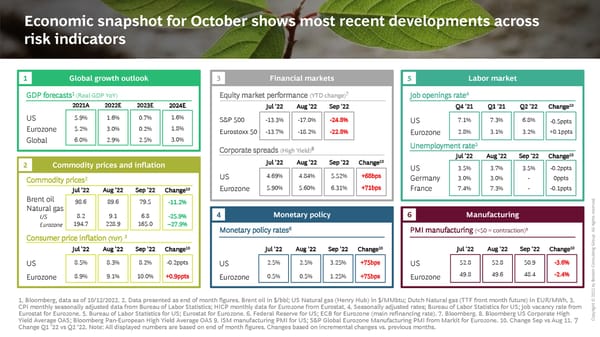
Economic snapshot for October shows most recent developments across risk indicators 1 Global growth outlook 3 Financial markets 5 Labor market 1 7 4 GDP forecasts (Real GDP YoY) Equity market performance (YTD change) Job openings rate 2021A 2022E 2023E 2024E Jul '22 Aug '22 Sep '22 Q4 '21 Q1 '21 Q2 '22 Change10 US 5.9% 1.6% 0.7% 1.6% S&P 500 -13.3% -17.0% -24.8% US 7.1% 7.3% 6.8% -0.5ppts Eurozone 5.2% 3.0% 0.2% 1.8% Eurostoxx 50 -13.7% -18.2% -22.8% Eurozone 2.8% 3.1% 3.2% +0.1ppts Global 6.0% 2.9% 2.5% 3.0% Unemployment rate5 8 Corporate spreads (High Yield) Jul '22 Aug '22 Sep '22 Change10 2 Commodity prices and inflation Jul '22 Aug '22 Sep '22 Change10 US 3.5% 3.7% 3.5% -0.2ppts Commodity prices2 US 4.69% 4.84% 5.52% +68bps Germany 3.0% 3.0% - 0ppts Jul '22 Aug '22 Sep '22 Change10 Eurozone 5.90% 5.60% 6.31% +71bps France 7.4% 7.3% - -0.1ppts Brent oil 98.6 89.6 79.5 -11.2% d. Natural gas veer US 8.2 9.1 6.8 -25.9% 4 Monetary policy 6 Manufacturing esr Eurozone 194.7 228.9 165.0 --27.9% l rights Monetary policy rates6 PMI manufacturing (<50 = contraction)9 Al Consumer price inflation (YoY) 3 . oupr Jul '22 Aug '22 Sep '22 Change10 Jul '22 Aug '22 Sep '22 Change10 Jul '22 Aug '22 Sep '22 Change10 G ting 8.5% 8.3% 8.2% -0.2ppts 2.5% 2.5% 3.25% +75bps 52.8 52.8 50.9 -3.6% sul US US US Con 8.9% 9.1% 10.0% +0.9ppts 0.5% 0.5% 1.25% +75bps 49.8 49.6 48.4 -2.4% ton Eurozone Eurozone Eurozone Bos by 2 202 1. Bloomberg, data as of 10/12/2022. 2. Data presented as end of month figures. Brent oil in $/bbl; US Natural gas (Henry Hub) in $/MMbtu; Dutch Natural gas (TTF front month future) in EUR/MWh. 3. © CPI monthly seasonally adjusted data from Bureau of Labor Statistics; HICP monthly data for Eurozone from Eurostat. 4. Seasonally adjusted rates; Bureau of Labor Statistics for US; Job vacancy rate from ight Eurostat for Eurozone. 5. Bureau of Labor Statistics for US; Eurostat for Eurozone. 6. Federal Reserve for US; ECB for Eurozone (main refinancing rate). 7. Bloomberg. 8. Bloomberg US Corporate High opyr Yield Average OAS; Bloomberg Pan-European High Yield Average OAS 9. ISM manufacturing PMI for US; S&P Global Eurozone Manufacturing PMI from Markit for Eurozone. 10. Change Sep vs Aug 11. 7 C Change Q1 '22 vs Q2 ‘22. Note: All displayed numbers are based on end of month figures. Changes based on incremental changes vs. previous months.
 The CEO's Dilemma Page 7 Page 9